


You type a goal into a race calculator, it hands back a number like 9:09, and you nod as if that means something. Then you go out the next morning, run what feels like a steady effort, check your watch at the first mile and see 10:20. Or 8:15. Neither of those is the pace you need, and you have no idea how far off you really are over 13.1 miles.
That gap between a goal time and the feel of a pace is where race plans fall apart. A good running pace chart closes it. Pick your pace per mile on the left, read across, and you get your pace per kilometer plus your finish time for a 5K, 10K, half marathon and marathon, all on one line.
Every number below was calculated for this page from the official race distances and rounded to the nearest second. It won’t make you faster, but it stops the guessing.

Who this chart is for and what you need first
This is for anyone with a race on the calendar or a time in their head, from first 5K to marathon. If you’re still building up to running continuously, start with our couch to 5K schedule and come back once you can run 30 minutes without stopping.
You need three things. A recent honest effort to anchor your numbers (a 5K race or a timed mile). A way to measure pace, whether that’s a GPS watch, a phone app or a treadmill display.
The running pace chart: 6:00 to 15:00 per mile
Distances used: 5K is 3.10686 miles, 10K is 6.21371 miles, the half marathon is 13.1094 miles (21.0975 km) and the marathon is 26.2188 miles (42.195 km). The half and full figures match the official distances published by World Athletics for the half marathon and the marathon. Finish times assume you hold that exact pace the whole way, start to finish.
| Pace per mile | Pace per km | 5K | 10K | Half marathon | Marathon |
|---|---|---|---|---|---|
| 6:00 | 3:44 | 0:18:38 | 0:37:17 | 1:18:39 | 2:37:19 |
| 6:30 | 4:02 | 0:20:12 | 0:40:23 | 1:25:13 | 2:50:25 |
| 7:00 | 4:21 | 0:21:45 | 0:43:30 | 1:31:46 | 3:03:32 |
| 7:30 | 4:40 | 0:23:18 | 0:46:36 | 1:38:19 | 3:16:38 |
| 8:00 | 4:58 | 0:24:51 | 0:49:43 | 1:44:53 | 3:29:45 |
| 8:30 | 5:17 | 0:26:24 | 0:52:49 | 1:51:26 | 3:42:52 |
| 9:00 | 5:36 | 0:27:58 | 0:55:55 | 1:57:59 | 3:55:58 |
| 9:30 | 5:54 | 0:29:31 | 0:59:02 | 2:04:32 | 4:09:05 |
| 10:00 | 6:13 | 0:31:04 | 1:02:08 | 2:11:06 | 4:22:11 |
| 10:30 | 6:31 | 0:32:37 | 1:05:15 | 2:17:39 | 4:35:18 |
| 11:00 | 6:50 | 0:34:11 | 1:08:21 | 2:24:12 | 4:48:24 |
| 11:30 | 7:09 | 0:35:44 | 1:11:27 | 2:30:45 | 5:01:31 |
| 12:00 | 7:27 | 0:37:17 | 1:14:34 | 2:37:19 | 5:14:38 |
| 12:30 | 7:46 | 0:38:50 | 1:17:40 | 2:43:52 | 5:27:44 |
| 13:00 | 8:05 | 0:40:23 | 1:20:47 | 2:50:25 | 5:40:51 |
| 13:30 | 8:23 | 0:41:57 | 1:23:53 | 2:56:59 | 5:53:57 |
| 14:00 | 8:42 | 0:43:30 | 1:27:00 | 3:03:32 | 6:07:04 |
| 14:30 | 9:01 | 0:45:03 | 1:30:06 | 3:10:05 | 6:20:10 |
| 15:00 | 9:19 | 0:46:36 | 1:33:12 | 3:16:38 | 6:33:17 |
How to read it in ten seconds
Say you ran a 5K in about 31 minutes. That puts you on the 10:00 per mile row, which is 6:13 per kilometer. Read across and you’ll see 1:02:08 for a 10K at that same pace, but don’t plan on it: you will slow down as distances get longer, so treat the longer columns as the best case for that pace, not a prediction.
The useful trick is to read the chart backwards. Start at the finish time you want, find the closest number in that column, then look left. That’s the pace you need to train your legs to recognize.

Common goal times and the pace they need
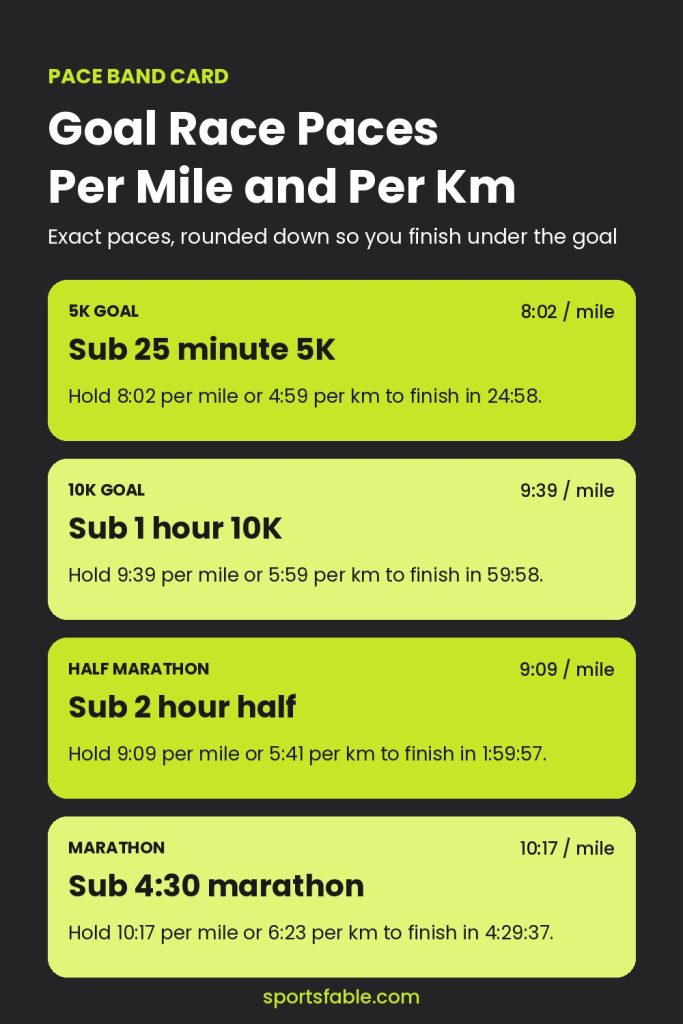
These paces are rounded down, not to the nearest second, because rounding up by even half a second can push you over. A 10:18 mile for a marathon, for example, finishes at 4:30:03. You need 10:17.
| Goal | Pace per mile | Pace per km | Finish at that pace |
|---|---|---|---|
| Sub 25 minute 5K | 8:02 | 4:59 | 0:24:58 |
| Sub 30 minute 5K | 9:39 | 5:59 | 0:29:59 |
| Sub 1 hour 10K | 9:39 | 5:59 | 0:59:58 |
| Sub 2 hour half marathon | 9:09 | 5:41 | 1:59:57 |
| Sub 4:30 marathon | 10:17 | 6:23 | 4:29:37 |
Notice the sub 30 minute 5K and the sub 1 hour 10K need the identical pace. Twice the distance, same speed. That’s a nice reality check: if a 30 minute 5K takes everything you have, a sub 1 hour 10K is a training goal, not a race-day surprise. The 10K training plan is built around exactly that jump.
Treadmill speed to pace conversion
Treadmills show speed in miles per hour, while your plan talks in minutes per mile. Here’s the conversion for the speeds most people run and walk at.
| Speed (mph) | Pace per mile | Pace per km | Speed (km/h) |
|---|---|---|---|
| 4.0 | 15:00 | 9:19 | 6.4 |
| 4.5 | 13:20 | 8:17 | 7.2 |
| 5.0 | 12:00 | 7:27 | 8.0 |
| 5.5 | 10:55 | 6:47 | 8.9 |
| 6.0 | 10:00 | 6:13 | 9.7 |
| 6.5 | 9:14 | 5:44 | 10.5 |
| 7.0 | 8:34 | 5:20 | 11.3 |
| 7.5 | 8:00 | 4:58 | 12.1 |
| 8.0 | 7:30 | 4:40 | 12.9 |
| 8.5 | 7:04 | 4:23 | 13.7 |
| 9.0 | 6:40 | 4:09 | 14.5 |
| 9.5 | 6:19 | 3:55 | 15.3 |
| 10.0 | 6:00 | 3:44 | 16.1 |
Treadmill pace and outdoor pace are not a perfect match. There’s no wind and no hills unless you add them. Some runners set a small incline to make it feel closer to the road. If you want structured sessions, our treadmill workouts use this same table.

Effort zones: easy, tempo and interval
Effort tells you whether a pace is right for today. The CDC describes two simple ways to judge intensity on its page about measuring physical activity intensity: a talk test (at moderate intensity you can talk but not sing, and at vigorous intensity you can’t say more than a few words without pausing for breath) and a 0 to 10 effort scale, where moderate sits around 5 or 6 and vigorous begins around 7 or 8. Here’s how we map those to running.
| Zone | Talk test | Effort out of 10 | How it fits your chart |
|---|---|---|---|
| Easy | Full sentences, no gasping | 4 to 6 | Often 1:00 to 2:00 per mile slower than 5K pace |
| Tempo | Short phrases only | About 7 | Comfortably hard, steady and controlled |
| Interval | A word or two | 8 to 9 | Short repeats near or faster than 5K pace, with recovery |
Easy runs
Most of your weekly running belongs here, and it’s the zone people get wrong most often. If you can’t chat in full sentences, slow down, even if the number on your watch feels embarrassing. Run/walk is a perfectly good way to stay easy: run a few minutes, walk one, repeat.
Tempo runs
Tempo is steady and controlled, not a race. You should finish feeling like you could have kept going for another 10 minutes. A common starting point is 15 to 20 minutes at tempo effort sandwiched between an easy warm-up and cool-down.
Intervals
Short and hard: think 400 meter to 1 kilometer repeats with an easy jog or walk between them. None at all is fine while you’re building a base.

The printable has the full pace chart from 6:00 to 15:00 per mile on page one and the treadmill conversion on page two, with space to circle your goal row and write your training paces.
Free printable
Two printable pages: the full 6:00 to 15:00 per mile pace chart with finish times, and a treadmill mph to pace conversion.
Download the free running pace chart (PDF)Here’s the pace band card with four common goal times and the exact pace each one needs. Save it or pin it so it’s on your phone before your next run.
How to adjust it and common mistakes
The honest cost of a pace chart: it makes running look like arithmetic, and it isn’t. Heat, hills, wind and poor sleep all slow you down, and the chart can’t see any of them. Let effort overrule the number on tough days.
Mistake 1: training at goal pace every day
If every run is at race pace, you’re tired all the time and never actually fast. Keep most runs easy by the talk test above, and save goal pace for specific sessions. A structured plan spaces those sessions for you.
Mistake 2: forgetting your course is longer than the course
Races are measured along the shortest legal route. You’ll weave and take wide corners, so your watch often reads a little long. Build a few seconds per mile of buffer into your goal pace instead of planning to hit the exact row.
Mistake 3: using a 5K result to predict a marathon
Each column shows the same pace held for longer, but real runners slow down as distance grows. Anchor longer races to a recent result at a similar distance.
Mistake 4: ignoring strength and shoes
Pace improves fastest when you can train consistently without breaking down. Two short sessions of strength training a week and shoes that fit your stride do more for your finish time than chasing a faster row on the chart.

Your pace chart checklist
- Anchor your pace with a recent, honest effort, not a hoped-for time.
- Circle your goal row and note pace per mile and per km.
- Round goal pace down, never up, and add a small buffer for course weaving.
- Keep most runs easy: full sentences, about 4 to 6 out of 10.
- One tempo or interval session a week is enough to start.
- Use the treadmill table to set the belt instead of guessing.
- Retest every 4 to 6 weeks and move rows only when your effort says so.
Keep going
Pair this chart with a plan and a way to track it. Our beginner hybrid athlete training plan shows how running fits alongside lifting, the printable workout tracker gives you somewhere to log every pace, and the half marathon training plan turns these paces into a 12-week schedule, and the weekly workout plan template helps you place easy, tempo and long runs in a real week. Heading out in the cold? Check our cold weather running outfits first.
New training plans: a 6-week 5K training plan and our 18-week marathon training plan.
Questions people ask
What pace should a tempo run be?
Tempo pace is comfortably hard: you can speak in short phrases but not hold a conversation, roughly a 7 out of 10 effort. A common guideline puts it between your 10K and half marathon race pace. Find your recent race row on the chart and run a little slower than that pace for 15 to 20 minutes.
How do I convert treadmill speed to pace?
Divide 60 by the speed in mph to get minutes per mile. So 6.0 mph is a 10:00 mile and 7.5 mph is an 8:00 mile. The treadmill table above does every half mph from 4.0 to 10.0, with pace per km included.
What pace do I need for a sub 2 hour half marathon?
You need 9:09 per mile or faster, which is 5:41 per kilometer. Held perfectly over 13.1094 miles, 9:09 finishes at 1:59:57, which leaves you only 3 seconds of margin, so most runners aim for a few seconds per mile quicker.
How far are the 5K, 10K, half marathon and marathon in miles?
A 5K is 3.10686 miles and a 10K is 6.21371 miles. World Athletics lists the half marathon at 21.0975 km (13.1094 miles) and the marathon at 42.195 km, or 26 miles and 385 yards.
How do I convert pace per mile to pace per km?
Divide your pace per mile (in seconds) by 1.609344. A 10:00 mile is 600 seconds, and 600 divided by 1.609344 is about 373 seconds, or 6:13 per km.
What is a good 5K running pace for beginners?
There’s no official beginner standard, so any pace you can finish at is a good start. Run your first 5K at an easy effort and use that time as your starting row: 12:00 per mile, for example, finishes in 0:37:17.
How much slower is marathon pace than 10K pace?
There’s no single number, because it depends on your training and how many long runs you’ve done. Expect a noticeable gap, and a bigger one if the marathon is your first.
If you have a medical condition, are pregnant, or are coming back from injury, check with a doctor before starting a new training plan.
Images in this article are AI-generated illustrations and original graphics created by SportsFable. They show training ideas, not real people or events. The printable is free for personal use.
Related Post